Cloud & Infrastructure · DevOps
Platform Engineering in 2026: The Internal Developer Platform Maturity Report
Data-driven analysis of platform engineering adoption in 2026. Compare Backstage, Port, and Cortex IDPs, golden paths, self-service infrastructure, and how to measure platform success with DORA metrics.

Anurag Verma
17 min read

Sponsored
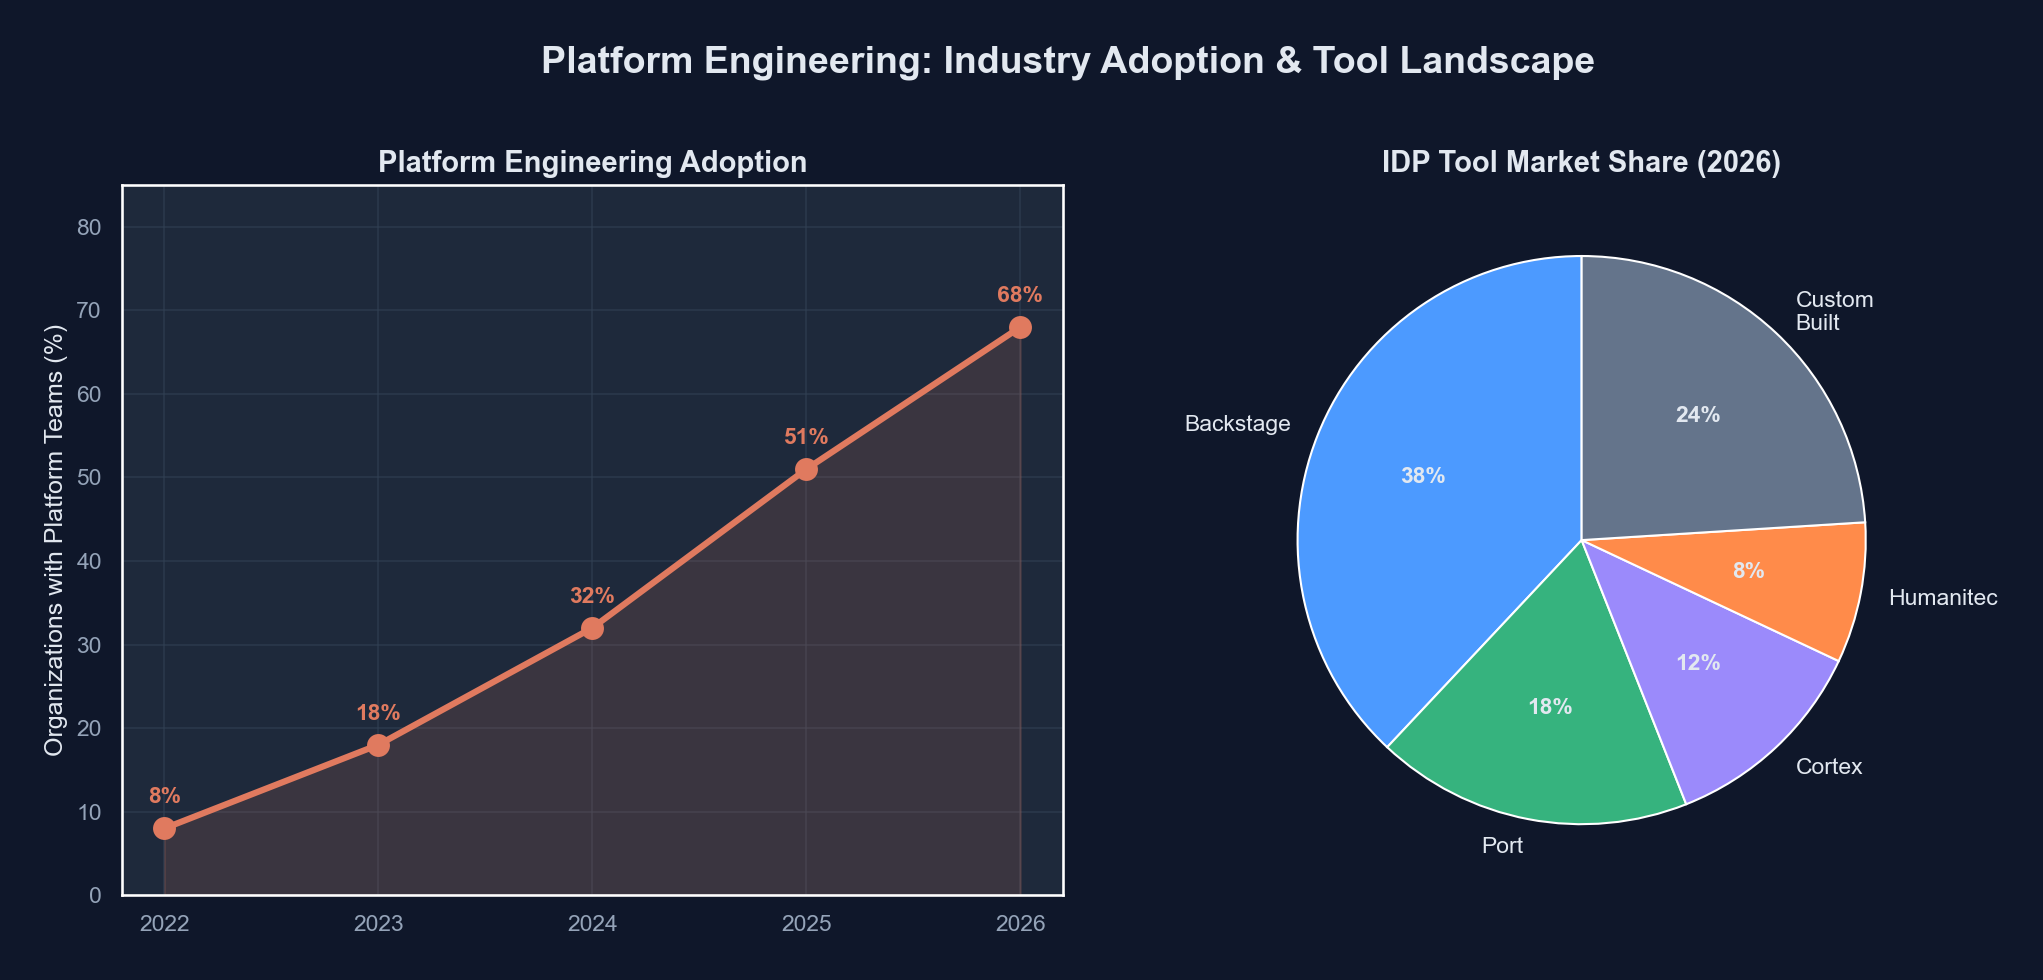
Seventy-eight percent of organizations with more than 500 engineers now operate a dedicated platform team. That number was 43% in 2023. The numbers tell a clear story: platform engineering is no longer a trend deck bullet point. It is how serious engineering organizations deliver infrastructure in 2026.
But the numbers also tell a more complicated story than the vendor pitch decks suggest. Adoption is high. Satisfaction is mixed. And the gap between organizations that treat platform engineering as a product discipline versus those that simply rebranded their DevOps team is widening into a chasm.
This analysis examines where platform engineering actually stands, which tools are winning, what golden paths look like in practice, and how the organizations getting the most value are measuring success.
The Shift From DevOps to Platform Engineering
DevOps was never supposed to be a job title. The original movement was about breaking down walls between development and operations, about shared ownership and cultural change. Somewhere along the way, “DevOps engineer” became a role that meant “the person who writes the Terraform and maintains the CI pipeline.”
Platform engineering emerged as a correction. Rather than expecting every application developer to become an infrastructure expert, platform teams build internal products that abstract away complexity. The developer gets a self-service interface. The platform team gets to standardize and govern without becoming a bottleneck.
The trajectory across the industry is unmistakable:
| Year | Orgs with dedicated platform teams | Avg platform team size | Self-service adoption rate |
|---|---|---|---|
| 2022 | ~28% | 3-4 engineers | 18% |
| 2023 | ~43% | 5-7 engineers | 31% |
| 2024 | ~59% | 6-9 engineers | 48% |
| 2025 | ~71% | 8-12 engineers | 62% |
| 2026 | ~78% | 10-15 engineers | 74% |
Sources: Puppet State of DevOps, Humanitec Platform Engineering surveys, Gartner infrastructure reports
These numbers deserve some caveats. “Dedicated platform team” covers a wide range of maturity levels. Some of these teams are building sophisticated internal developer platforms with service catalogs, automated provisioning, and integrated observability. Others renamed their infrastructure team and called it done. The self-service adoption rate measures whether developers can provision resources without filing a ticket, not whether the experience is actually good.
 The platform engineering maturity spectrum ranges from rebranded ops teams to fully productized internal platforms
The IDP Landscape: Backstage, Port, Cortex, and the Rest
The Internal Developer Platform (IDP) tooling market has consolidated significantly. Three platforms dominate the conversation, though they serve different segments and philosophies.
Backstage (Spotify)
Backstage remains the gravitational center of the IDP ecosystem. Open-sourced by Spotify in 2020 and now a CNCF Incubating project, it has accumulated the largest community and plugin ecosystem. By early 2026, the Backstage plugin marketplace lists over 200 plugins, and the project claims adoption by more than 3,000 organizations.
The architecture is straightforward: a React frontend, a Node.js backend, and a PostgreSQL database. Everything is extensible through a plugin system. The software catalog is the core primitive, modeling services, APIs, resources, and their ownership.
# catalog-info.yaml - Backstage service definition
apiVersion: backstage.io/v1alpha1
kind: Component
metadata:
  name: payment-service
  description: Handles payment processing and settlement
  annotations:
    github.com/project-slug: acme/payment-service
    pagerduty.com/service-id: P2KLBN7
    backstage.io/techdocs-ref: dir:.
  tags:
    - payments
    - critical-path
    - java
  links:
    - url: https://grafana.internal/d/payment-service
      title: Grafana Dashboard
      icon: dashboard
spec:
  type: service
  lifecycle: production
  owner: team-payments
  system: checkout-system
  providesApis:
    - payment-api
  consumesApis:
    - fraud-detection-api
    - notification-api
  dependsOn:
    - resource:payments-db
    - resource:payments-redis
The honest assessment: Backstage is powerful but expensive to operate. Organizations consistently report that standing up a basic Backstage instance takes 2-4 weeks, but reaching production-grade maturity takes 6-12 months and requires 2-3 dedicated engineers for ongoing maintenance. The plugin quality varies wildly. Some are production-hardened, others are weekend projects with a README and a prayer.
Port
Port has carved out a strong position as the “Backstage without the operational burden” option. As a SaaS platform, it eliminates the self-hosting overhead and offers a no-code builder for self-service actions, scorecards, and dashboards.
Port’s data model is more flexible than Backstage’s. Rather than a fixed catalog schema, Port lets you define arbitrary “blueprints” for any entity type and map relationships between them. This flexibility is a double-edged sword: it avoids the rigidity of Backstage’s entity kinds, but it means you need to design your own data model from scratch.
Cortex
Cortex focuses heavily on service maturity and operational readiness. Its scorecards and service quality dashboards are arguably the most polished in the market. Cortex answers the question “are our services meeting our standards?” better than any alternative.
Where Cortex differentiates is in its opinionated approach to service quality. Out of the box, it provides maturity rubrics for production readiness, security compliance, documentation coverage, and operational hygiene. For organizations whose primary pain point is inconsistent service quality rather than missing self-service capabilities, Cortex is often the better starting point.
Comparative Analysis
| Feature | Backstage | Port | Cortex |
|---|---|---|---|
| Deployment | Self-hosted | SaaS | SaaS |
| Initial setup time | 2-4 weeks | 1-3 days | 1-2 days |
| Time to production maturity | 6-12 months | 1-3 months | 1-2 months |
| Ongoing maintenance cost | 2-3 FTE | ~0.5 FTE | ~0.5 FTE |
| Plugin/integration ecosystem | 200+ plugins | 70+ integrations | 50+ integrations |
| Software catalog | Strong | Strong | Moderate |
| Self-service actions | Via plugins | Native, no-code | Limited |
| Scorecards/maturity | Via plugins | Native | Best-in-class |
| Customization ceiling | Very high | Moderate | Low-moderate |
| Cost at 500 engineers | Infra + FTE (~$400K/yr) | $150K-250K/yr | $120K-200K/yr |
| Best for | Large orgs, deep customization | Mid-market, fast time-to-value | Service quality focus |
Golden Paths: Paved Roads, Not Walled Gardens
The term “golden path” has become central to platform engineering vocabulary. It refers to a pre-built, opinionated, and well-supported path for completing common development tasks: creating a new service, deploying to production, provisioning a database, setting up observability.
The philosophy matters more than the implementation. A golden path should be the easiest option, not the only option. Engineers should be able to deviate when they have good reason, but the default path should be so good that most teams never want to.
Here is what a mature golden path looks like for service creation in 2026:
// platform-cli: Golden path service scaffolding
// This is what developers actually interact with

interface ServiceTemplate {
  name: string;
  runtime: "node" | "go" | "python" | "java";
  tier: "critical" | "standard" | "experimental";
  dataStores: DataStoreConfig[];
  apis: ApiConfig[];
  team: string;
}

interface DataStoreConfig {
  type: "postgres" | "redis" | "dynamodb";
  size: "small" | "medium" | "large";
  highAvailability: boolean;
}

// The golden path generates:
// 1. GitHub repo with CI/CD pipeline
// 2. Kubernetes manifests (namespace, deployment, service, HPA)
// 3. Database provisioned via Crossplane
// 4. Observability stack (metrics, logs, traces, alerts)
// 5. Backstage catalog entry
// 6. PagerDuty service + escalation policy
// 7. Security scanning pipeline (SAST, SCA, container scanning)
// 8. Load testing baseline
# Developer experience: one command, full service scaffold
$ platform create service \
--name order-processing \
--runtime go \
--tier critical \
--datastore postgres:medium:ha \
--datastore redis:small \
--team checkout \
--api grpc
Creating service: order-processing
[OK] GitHub repository created
[OK] CI/CD pipeline configured (build, test, scan, deploy)
[OK] Kubernetes namespace and RBAC provisioned
[OK] PostgreSQL (medium, HA) provisioning initiated
[OK] Redis (small) provisioning initiated
[OK] Datadog monitors and dashboards created
[OK] PagerDuty service linked to team-checkout
[OK] Backstage catalog entry registered
[OK] Security scanning pipeline enabled
Service will be ready at:
Dev: https://order-processing.dev.internal
Staging: https://order-processing.staging.internal
Estimated time to full provisioning: ~4 minutesThe organizations doing this well share common characteristics. They treat templates as products with versioning, deprecation policies, and upgrade paths. They measure template adoption rates and actively investigate why teams deviate. And critically, they involve application developers in template design rather than building in isolation.
Self-Service Infrastructure: The Promise and the Reality
Self-service infrastructure is the flagship capability of platform engineering. The promise is compelling: developers provision what they need, when they need it, without waiting for a ticket to be processed. The platform enforces guardrails, security policies, and cost controls behind the scenes.
The reality in 2026 is that most organizations have achieved partial self-service. Developers can typically provision development environments, create CI/CD pipelines, and spin up standard infrastructure components. But production-grade resources, security-sensitive configurations, and cost-significant infrastructure often still require approval workflows.
This is not necessarily a failure. Fully automated provisioning of production databases with no human review is not appropriate for every organization. The mature approach is tiered self-service:
# Example: Tiered self-service policy
self_service_tiers:
  # Tier 1: Fully automated, no approval needed
  automatic:
    - dev_namespace_creation
    - ci_cd_pipeline_setup
    - feature_branch_environments
    - non_production_databases (size <= medium)
    - redis_cache_instances
    - s3_buckets (non_public)

  # Tier 2: Auto-approved with notification
  auto_approved_notify:
    - staging_deployments
    - non_production_databases (size == large)
    - api_gateway_routes
    - dns_records (internal)

  # Tier 3: Requires single approval (platform team)
  single_approval:
    - production_deployments (first deploy)
    - production_databases
    - public_dns_records
    - third_party_integrations

  # Tier 4: Requires security + platform approval
  dual_approval:
    - public_s3_buckets
    - iam_role_modifications
    - vpc_peering
    - secrets_management_access
    - compliance_scope_changes
The tooling underneath self-service has matured significantly. Crossplane has emerged as the dominant Kubernetes-native infrastructure provisioning layer, with Terraform still handling the bulk of actual cloud resource creation. The pattern of “Crossplane for the abstraction, Terraform for the execution” has become something of an industry standard for organizations running on Kubernetes.
 Modern self-service portals abstract cloud complexity behind intent-based interfaces
Platform Teams vs. DevOps Teams: The Organizational Question
The organizational design question is where many platform engineering initiatives succeed or fail. The tooling is the easy part. The hard part is defining responsibilities, setting boundaries, and managing the relationship between platform teams and the application teams they serve.
The most effective model treats the platform team as an internal product organization. This means:
Product management discipline. Platform teams that succeed have a product manager (or a technical lead who thinks like one) who maintains a roadmap based on developer feedback, usage data, and strategic priorities. They conduct user research. They track adoption metrics. They deprecate features intentionally.
Clear interfaces. The platform team publishes an API (literal or conceptual) and commits to its stability. Application teams should not need to understand the internals of the platform. They should not need to attend a meeting to use it.
Funding model. Platform teams funded as cost centers inevitably get squeezed when budgets tighten. The organizations that sustain platform investment tie funding to measurable outcomes: reduced time-to-production, decreased incident rates, improved developer satisfaction scores.
A pattern that consistently fails: the “platform team” that is actually a renamed operations team with no change in operating model. If your platform team still receives tickets, still manually provisions resources, and still defines success as “kept the lights on,” you have a DevOps team with a new name. There is nothing wrong with having a DevOps team, but calling it platform engineering creates misaligned expectations.
The staffing ratios have converged around industry norms. Most organizations target a platform-engineer-to-application-developer ratio between 1:15 and 1:25. Below 1:15, you are likely over-investing relative to the returns. Above 1:30, the platform team cannot maintain quality while iterating on new capabilities.
Measuring Platform Success
This is where the analytical framing matters most. Platform engineering is expensive. A mature platform team of 12 engineers, fully loaded, costs $2.5-4M per year depending on geography. That investment needs measurable returns.
DORA Metrics
The DORA (DevOps Research and Assessment) metrics remain the gold standard for measuring software delivery performance. Platform engineering should demonstrably improve these numbers:
Deployment frequency. How often does your organization deploy to production? Effective platforms remove friction from the deployment process, enabling more frequent releases. Organizations with mature IDPs report 3-5x improvement in deployment frequency within the first 18 months of platform adoption.
Lead time for changes. The time from code commit to running in production. Standardized CI/CD pipelines and automated environments compress this dramatically. The median improvement reported is from 2-5 days to under 4 hours.
Change failure rate. The percentage of deployments that result in a degraded service. Golden paths with built-in testing, security scanning, and canary deployments consistently reduce this. Typical improvement: from 15-25% down to 5-10%.
Mean time to recovery (MTTR). When failures occur, how quickly does the organization recover? Platforms that integrate observability, runbooks, and automated rollback reduce MTTR significantly. Reported improvements range from 50-75% reduction.
Developer Satisfaction and Productivity
DORA metrics capture delivery performance but miss the human dimension. The most sophisticated platform organizations also track:
Developer experience surveys. Quarterly surveys measuring satisfaction with tooling, friction points, and unmet needs. These should include Net Promoter Score for the platform itself: “How likely are you to recommend the internal platform to a colleague?”
Time to first deploy. For a new engineer joining the organization, how long until they deploy their first change to production? This is a powerful proxy for onboarding quality and platform usability. Best-in-class organizations achieve this in under one day.
Cognitive load assessments. How much infrastructure knowledge does a developer need to carry? This is harder to measure but can be approximated through surveys and by tracking how often developers need to consult documentation or ask for help with infrastructure tasks.
// Example: Platform metrics dashboard data model
interface PlatformMetrics {
  dora: {
    deploymentFrequency: {
      daily: number;
      trend: "improving" | "stable" | "declining";
      percentileRank: "elite" | "high" | "medium" | "low";
    };
    leadTimeForChanges: {
      medianHours: number;
      p95Hours: number;
      trend: "improving" | "stable" | "declining";
    };
    changeFailureRate: {
      percentage: number;
      rollingWindow: "30d" | "90d";
    };
    mttr: {
      medianMinutes: number;
      p95Minutes: number;
    };
  };
  developerExperience: {
    nps: number; // -100 to 100
    satisfactionScore: number; // 1-10
    timeToFirstDeploy: {
      medianHours: number;
      targetHours: number;
    };
    selfServiceAdoptionRate: number; // percentage
    ticketVolume: {
      current: number;
      trend: "decreasing" | "stable" | "increasing";
    };
  };
  platformHealth: {
    goldenPathAdoption: number;
    templateCoverage: number;
    platformUptime: number;
    pluginMaintenance: {
      upToDate: number;
      deprecated: number;
      unmaintained: number;
    };
  };
}
The Metrics That Actually Matter
Here is a synthesis of what the high-performing platform organizations are tracking, ranked by predictive value for platform success:
- Self-service completion rate. Of all infrastructure requests initiated through the platform, what percentage complete without human intervention? Target: >80%.
- Golden path adoption. What percentage of new services use the standard templates? Target: >70%. Below 50% indicates your golden paths are not meeting developer needs.
- Time from idea to production. End-to-end cycle time for a new service, from initial request to serving production traffic. This captures the full value chain.
- Developer NPS. Below 20 means your platform is tolerated, not valued. Above 40 means you are building something developers genuinely prefer over the alternatives.
- Ticket deflection rate. Month-over-month reduction in infrastructure support tickets. If this is not declining, your self-service capabilities are not working.
Real Adoption Numbers: What the Data Shows
The aggregate numbers are encouraging, but the distribution matters. Platform engineering adoption follows a bimodal pattern rather than a normal distribution. Organizations tend to cluster at two ends: either they have invested seriously and are seeing clear returns, or they are in the early stages with minimal impact.
Gartner’s 2025 infrastructure survey estimated that among organizations with platform teams, roughly 35% have reached “Level 4” maturity (self-service for most common workflows, measured developer satisfaction, automated governance). Another 40% are at “Level 2-3” (partial self-service, some golden paths, basic catalog). The remaining 25% are at “Level 1” (rebranded team, minimal tooling changes).
The correlation between maturity level and measurable outcomes is strong. Level 4 organizations report deployment frequencies 8-10x higher than their pre-platform baselines. Level 2-3 organizations report 2-4x improvements. Level 1 organizations report no measurable change, which is expected given that they have not meaningfully changed their operating model.
What 2026 Has Clarified
After several years of hype, experimentation, and iteration, a few things are now clear about platform engineering.
It is not DevOps 2.0. Platform engineering is a product discipline applied to infrastructure. Organizations that approach it as a rebrand fail. Organizations that approach it as product development succeed.
The build-vs-buy decision has shifted toward buy. In 2023, most organizations chose Backstage because it was the only credible option and they wanted control. In 2026, the SaaS alternatives have matured enough that the “build it ourselves” argument requires stronger justification. The total cost of ownership for self-hosted Backstage frequently exceeds the licensing cost of Port or Cortex once you account for the engineering time.
Golden paths only work if they are genuinely golden. If your paved road has potholes, developers will off-road. The organizations succeeding with golden paths invest continuously in template quality, upgrade paths, and developer feedback loops.
Measuring success is non-negotiable. Platform teams that cannot articulate their impact in quantitative terms are perpetually at risk of budget cuts. DORA metrics provide the foundation, but developer satisfaction and self-service adoption rates are equally important.
The staffing model matters more than the tooling. A mediocre IDP operated by a team with strong product instincts and deep empathy for developers will outperform a technically superior IDP built by a team that thinks of developers as users who need to be told what to do.
Platform engineering has crossed from “interesting idea” to “industry standard practice.” The question is no longer whether to invest in it, but how to invest in it well. The data suggests that the organizations getting the most value are the ones treating their internal platform with the same rigor they apply to their customer-facing products: product management, user research, iterative development, and relentless focus on the developer experience.
The tooling will continue to evolve. The organizational and cultural foundations will remain the differentiator.
Sponsored
More from this category
More from Cloud & Infrastructure
R.01 Blue-Green and Canary Deployments: A Production Guide for Engineering Teams
 R.02
R.02 eBPF in 2026: The Observability Superpower Hiding in Your Linux Kernel
 R.03
R.03 Tailscale for Distributed Dev Teams: Private Networks Without the VPN Pain
Sponsored
Discussion
Join the conversation.
Comments are powered by GitHub Discussions. Sign in with your GitHub account to leave a comment.
Sponsored